Overview
You observe that your Kerio Connect application/service is crashing or displaying sluggish and degraded performance with a high CPU or RAM load (95-100%).
Upon reaching the Hardware limitations, Kerio Connect may be generating crash dumps.
Solution
Prerequisites: Kerio Connect installed on Linux, macOS or Windows.
The Kerio Connect service has crashed unexpectedly, generating core process dumps. The dump files are located in different folders depending on the guest OS. Please see Additional Information for details for Linux and macOS.
The locations to look for the crash dumps are:
-
Windows: Windows machines will generate a .dmp file in the following locations:
- C:\Program Files\Kerio\MailServer
- %TEMP%\Kerio\crash\
-
Linux: The naming format is
core.PIDor simplycore, Check the following locations:- /opt/kerio/mailserver
- /var/crash
-
MacOS:
- /usr/local/kerio/mailserver : Kerio will generate a core file here
- /Library/Logs/CrashReporter/ : Kerio will generate a .crash file here
- /Library/Logs/DiagnosticReports/
Linux
-
Transfer
core.PIDfile to your Kerio Connect server running on Linux OS. You can use thewgettool to pull it from the public link. Alternatively, you can transfer it using the SCP tool. -
Install the gdb package. For Debian/Ubuntu distros, run the command:
sudo apt install gdb
-
Open the Kerio Connect installation directory.
cd /opt/kerio/mailserver
-
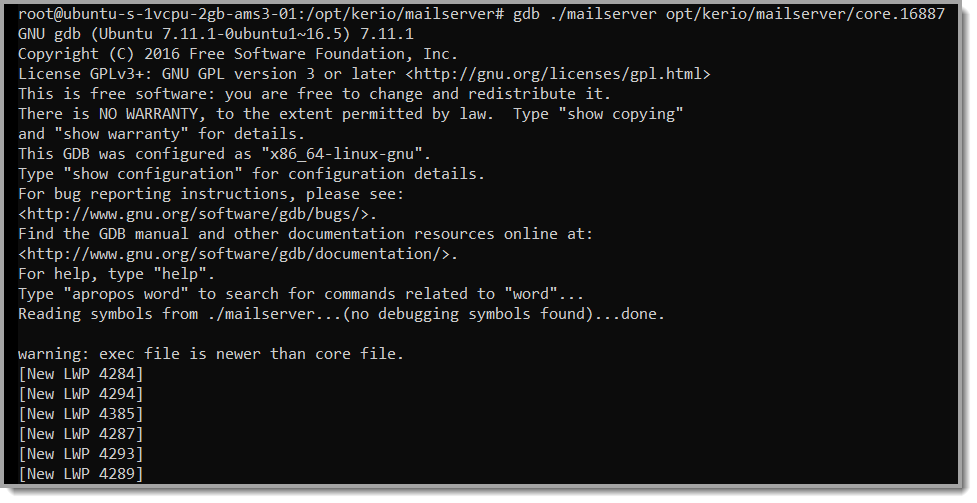
Run the command below to enter gdb Debug mode:
gdb ./mailserver <path_to_core_file>
You will receive a similar output.
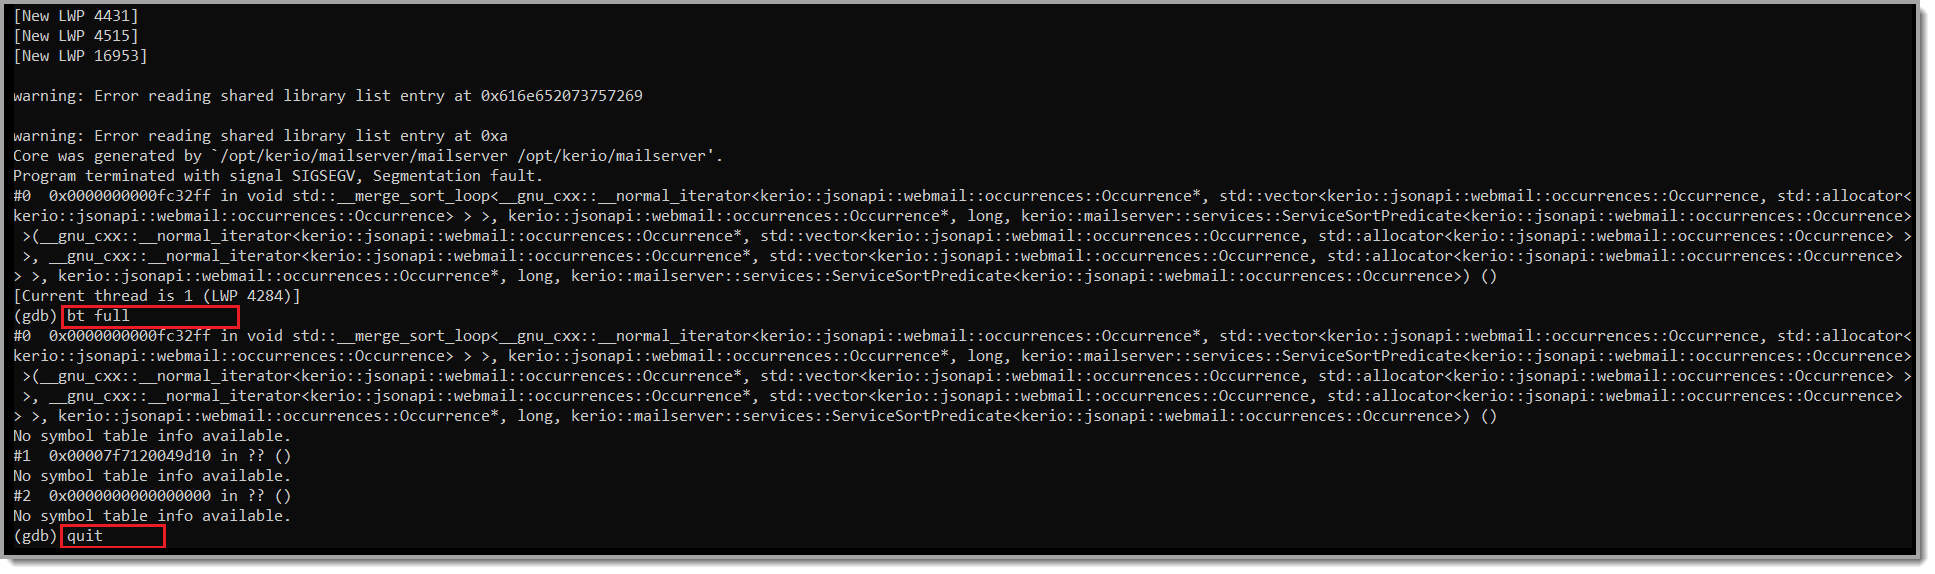
- Run the
bt fullcommand to expedite Backtrace deeper. To exit gdb, run thequitcommand.
- Once the necessary info is gathered, please share it through your Support Ticket.
<supportagent>
Support agents should use debug symbols for better output. Please check Locating Debug Symbols - Kerio Connect. The steps are similar for the Linux symstore, but you will need to go to "Engine Linux" from the actual build version (so it will be search > build version > engine > symstore).
The debug symbols can be loaded with
gdb /path/to/mailserver /path/to/core
add-symbol-file /path/to/debug/symbols
After that you can:
btto get a backtrace of the call stack:info registersto see the state of the CPU registers:listto view the source code around the location where the crash occurredframefollowed by a frame number to navigate through the stack trace- You can inspect variables within each frame with print <variable_name>
</supportagent>
Windows
-
Follow the MS guide on how to read Windows memory dumps.
-
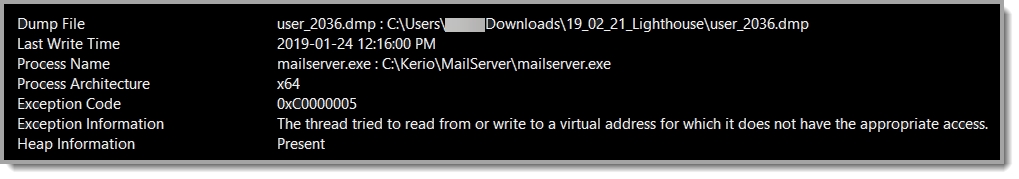
Alternatively, download and install Visual Studio Community edition and open the
user_<number>.dmpfile. You can install Windows Debugging Tools. Please note that the latest Windows SDK should be installed as part of the VS installation for the .dmp files to be recognized. -
You will receive a similar output.
<supportagent>
Support agents should use Visual Studio for debugging crash .dmp files, as this provides a way better output. However, please note that it will require you to have the symbol tables available for full debugging. Please check Locating Debug Symbols - Kerio Connect.
</supportagent>
Additional Information
While crashing, Kerio Connect generates a Crash Dump file. Crash dumps get stored in the same directory that has your configuration file. The name will vary based on OS:
On a Linux system :
It may be named core.PID, where PID is the process ID that crashed (for example core.7914) or simply core. It might be located in the /cores folder as well.
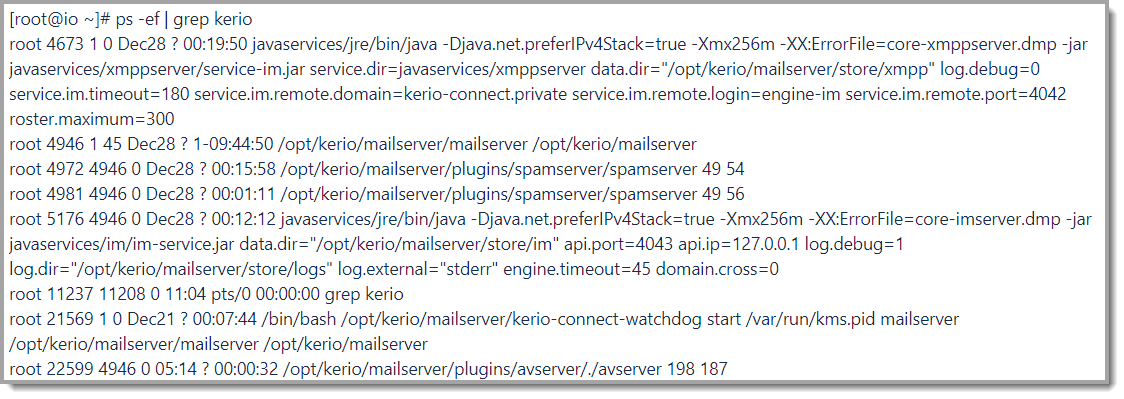
The main Kerio Connect processes are:
avserver
spamserver
keriobda
mailserver
java
If the server is crashing because of Kerio Connect, the dmesg (also present in the support information file gathered from Unix servers) will show PID of the Process + Name of faulty process. For example, if Antivirus caused a crash, it will show something like this:
[6773371.959054] avserver cpuset=/ mems_allowed=0
<CALL TRACE>
[6773371.959550] Out of memory: Kill process 22031 (avserver) score 324 or sacrifice child
[6773371.964829] Killed process 22031 (avserver) total-vm:1022968kB, anon-rss:683648kB, file-rss:324kB
Another example is for the crash due to a lack of RAM. It is advisable to increase the amount of RAM even if the server still meets the Server Requirements. Example dmesg output:
The OOM Killer utility job is to free up resources when there is not enough memory for the OS to load any new applications. More information is available in the 3-party article: the Linux OOM Killer
On macOS
Related Articles
Troubleshooting Performance Issues in Kerio Connect
Kerio Connect Service Crashes and Restarts
Priyanka Bhotika
Comments